import altair as alt
from vega_datasets import data
from rpcjs import Dashboard, Page, set_attribute
import rpcjs.elements as html
import rpcjs.binded as forms
source = data.cars()
columns = list(source.columns)
class MyDynamicPage(Page):
def routes(self):
return '/'
def __init__(self):
self.title = 'MyDynamicPage'
self.xlabel = None
self.ylabel = None
def make_form(self):
"""Make a simple form so the user can input the x and y axis"""
self.xlabel, xlabel_html = forms.select_dropdown(columns, callback=self.make_graph)
self.ylabel, ylabel_html = forms.select_dropdown(columns, callback=self.make_graph)
form = html.div(
html.div(
html.header('X axis', level=5),
xlabel_html),
html.div(
html.header('Y axis', level=5),
ylabel_html))
return form
def make_graph(self):
"""Generate the graph when all the inputs are ready"""
xlabel = self.xlabel.get()
ylabel = self.ylabel.get()
if xlabel is None or ylabel is None:
return
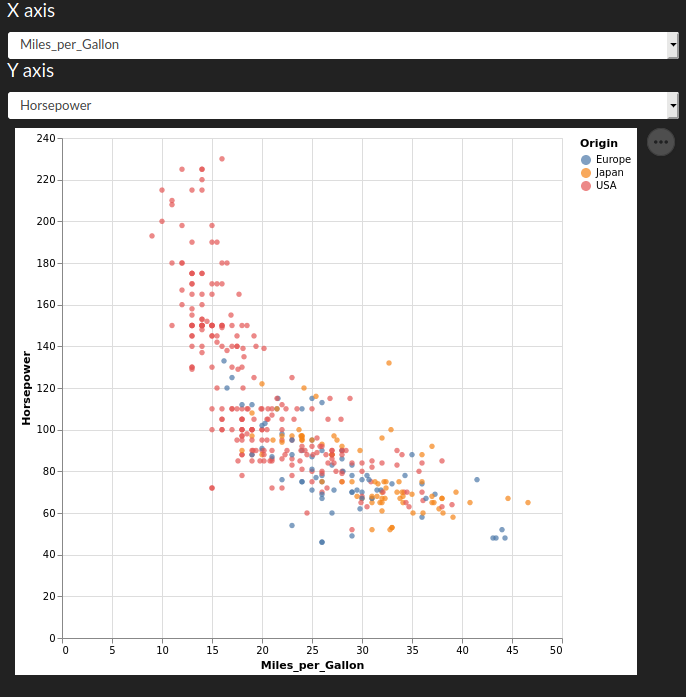
chart = alt.Chart(source).mark_circle().encode(
alt.X(xlabel, type='quantitative'),
alt.Y(ylabel, type='quantitative'),
color='Origin:N'
).properties(
width=500,
height=500
).interactive()
# send our graph back to the page
set_attribute('graph_id', 'srcdoc', html.altair_plot(chart, with_iframe=False))
def main(self):
return html.div(
self.make_form(),
# where our graph will be populated
html.iframe("", id='graph_id'))
if __name__ == '__main__':
# go to http://127.0.0.1:5000/
with Dashboard(__name__) as dash:
dash.add_page(MyDynamicPage())
dash.run()